<!--
// © University of Southampton IT Innovation Centre, 2017
//
// Copyright in this software belongs to University of Southampton
// IT Innovation Centre of Gamma House, Enterprise Road,
// Chilworth Science Park, Southampton, SO16 7NS, UK.
//
// This software may not be used, sold, licensed, transferred, copied
// or reproduced in whole or in part in any manner or form or in or
// on any media by any person other than in accordance with the terms
// of the Licence Agreement supplied with the software, or otherwise
// without the prior written consent of the copyright owners.
//
// This software is distributed WITHOUT ANY WARRANTY, without even the
// implied warranty of MERCHANTABILITY or FITNESS FOR A PARTICULAR
// PURPOSE, except where stated in the Licence Agreement supplied with
// the software.
//
// Created By : Michael Boniface
// Created Date : 18-12-2017
// Created for Project : FLAME
-->
## **Cross-Layer Management and Control Information Model**
This document provides an overview of the FLAME CLMC information model in support of service management and control decisions. The information model is designed to support the exploration and understanding of state and factors contributing to changes in state over time as shown in the primitive below:
The system (infrastructure, platform and media services) are composed of a set of configuration items that transition between different states during the lifecycle of the system. Configuration items of interest include significant components who's state change influence the response of the system. In general, the information aims to support the process of:
* Identification of significant configuration items within the system
* Assertion of state using configuration measurements
* Measurement of response (monitoring measurements)
* Support for taking action (configuration measurements)

This process is implemented in accordance with information security and privacy constraints. The following sections provides an overview of key aspects of monitoring.
### Media Service
The FLAME architecture defines a media services as "An Internet accessible service supporting processing, storage and retrieval of content resources hosted and managed by the FLAME platform". A media service consists of 1 or more media components (also known as Service Functions) that together are composed to create an overall Service Function Chain. SFs are realised through the instantiation of virtual machines (or containers) deployed on servers based on resource management policy. Multiple VMs may be instantiated for each SF to create surrogate SFs, for example, to balance load and deliver against performance targets. Media Services, SFCs, SFs, VMs, links and servers are all examples of configuration items.
Media services are described using a template structured according to the TOSCA specification (http://docs.oasis-open.org/tosca/TOSCA/v1.0/TOSCA-v1.0.html). A TOSCA template includes all of the information needed for the FLAME orchestrator to instantiate a media service. This includes all SF's, links between SFs and resource configuration information. The Alpha version of the FLAME platform is based on the current published TOSCA specification. Future developments will extend the TOSCA specification (known as TOSCA++) to meet FLAME requirements such as higher level KPIs and location-based constraints.
The current TOSCA template provides the initial structure of the Media Service information model through specified service and resource configuration. Within this structure, system components are instantiated whose runtime characteristics are measured to inform management and control processes. Measurements relate to individual SF's as well as aggregated measurements structured according the structure of configured items within the system. Measurements are made by monitoring processes deployed with system components. The configured items provide the context for monitoring.
The media information model in relation to the high-level media service lifecycle is shown in the diagram below. The lifecycle includes processes for packaging, orchestration, routing and SF management/control. Each stage in the process creates context for decisions and measurements within the next stage of the lifecycle. Packaging creates the context for orchestration, orchestration creates the context for endpoint instantiation, and network topology management. In the diagram, the green concepts identify the context which can be used for filtering and queries whilst the yellow concepts are the measurement data providing runtime measurements.

The primary measurement point for a media service is an endpoint. An endpoint is an instantation of a service function within a VM or container on a server. An endpoint exists within two main contexts: media service and virtual infrastructure. The media service context relates to the use of the endpoint within a service function chain designed to deliver content. The virtual infrastructure context relates to the host and network environment into which the endpoint is deployed. Deploying monitoring agents in different contexts and sharing information between contexts is a key part of cross-layer management and control.
The diagram highlights the need to monitor three views on an endpoint: network, host, and service. The acquisition of these different views together are a key element of the cross-layer information required for management and control. The measurements are captured by different processes running on servers but are brought together by common context allowing the information to be integrated, correlated and analysed. The endpoint can measure a service view related to the content being delivered such as request rates, content types, etc, a VM can measure a virtual infrastructure view of a single endpoint, and the server view can measure an infrastructure view across multiple endpoints deployed on a server. These monitoring processes running on the server are managed by different stakeholders, for example, the platform operator would monitor servers, where as the media service provider would monitor service specific usage.
Not all information acquired will be aggregated and stored within the CLMC. The CLMC is not responsible for capturing every measurement point related to transferring bytes over the network. It's also not responsible for capturing every interaction between a user and a service. The key design principle is to acquire information from one context that can be used in another context. For example, instead of recording every service interaction an aggregate service usage metric (e.g. request rate/s) would be acquired and stored, and the similar aggregation would be needed for infrastructure monitoring.
### Configuration
Configuration information describes the structure and state of the system over time. Each configuration item has a lifecycle that defines configuration states and events that cause a transition between states. The following table gives examples of configuration items and states.
### Monitoring
Monitoring measures the behaviour of the system and system components overtime including metrics associated with usage and performance. Measurements are made within the context of a known configuration state. Usage monitoring information can include measurements such as network resource usage, host resource usage and service usage. Performance monitoring information can include measurements such as cpu/s, throughput/s, avg response time and error_rate
### Information Security
*to be completed*
### Data Subject
*to be completed*
## **Measurement Model**
### General
The measurement model is based on a time-series model defined by TICK stack from influxdata called the line protocol. The protocol defines a format for measurement samples which together can be combined to create series.
`<measurement>[,<tag-key>=<tag-value>...] <field-key>=<field-value>[,<field2-key>=<field2-value>...] [unix-nano-timestamp]`
Each series has:
* a name "measurement"
* 0 or more tags for measurement context
* 1 or more fields for the measurement values
* a timestamp.
The model is used to report both configuration and monitoring data. In general, tags are used to provide configuration context for measurement values stored in fields. The tags are structured to provide queries by KPIs and dimensions defined in the FLAME architecture.
Tags are automatically indexed by InfluxDB. Global tags can be automatically inserted by contexualised agents collecting data from monitoring processes. The global tags used across different measurements are a key part of the database design. Although, InfluxDB is schemaless database allowing arbirtary measurement fields to be stored (e.g. allowing for a media component to have a set of specific metrics), using common global tags allows the aggregation of measurements across time with a known context.
Although similar to SQL, InfluxDB is not a relational database and the primary key for all measuremetns is **time**. Schema design recommendations can be found here: https://docs.influxdata.com/influxdb/v1.4/concepts/schema_and_data_layout/
### Temporal Measurements
Monitoring data must have time-stamp values that are consistent and sychronised across the platform. This means that all VMs hosting SFs should have a synchronised system clock, or at least (and more likely) a means by which an millisecond offset from the local time can be retrieved so that a 'platform-correct' time value can be calculated.
*Describe approaches to integrate temporal measurements, time as a primary key, etc.*
*Discuss precision*
influx -precision rfc3339 : The -precision argument specifies the format/precision of any returned timestamps. In the example above, rfc3339 tells InfluxDB to return timestamps in RFC3339 format (YYYY-MM-DDTHH:MM:SS.nnnnnnnnnZ).
### Spatial Measurements
Location can be represented in forms: labelled (tag) and numeric (longitude and latitude as digitial degrees). Note that the location label is likely to be a _global tag_.
Tag location
| location | loc_long | loc_lat |
| --- | --- | --- |
| DATACENTRE_1 | 0 | 0 |
An endpoint is placed on a server has has no means to obtain GPS coordinates but has a _location_label_ provided to it as a server context. It provides zeros in the longitude and latitude. In subsequent data analysis we can search for this SF by location label.
GPS coordination location
| location_label | location_long | location_lat |
| --- | --- | --- |
| LAMP_1 | 50.842715 | -0.778276 |
A SF that is a proxy to a user attached to a NAP running in street lamp post LAMP_1. Here we have knowledge both of the logical location of the service and also the fine-grained, dynamic position of the service user.
Note that tags are always strings and cannot be floats, therefore log and lat will always be stored as a measurement field.
*Discuss integrating and analysing location measurements*
If tags are used then measurements of GPS coordinates will need to be translated into tag based approximation. For example, if a user device is tracking location information then for that to be combined with a server location the GPS coordinate needs to be translated.
Matching on tags is limited to matching and potentially spatial hierarchies (e.g. country.city.street). Using a coordiante system allows for mathatical functions to be developed (e.g. proximity functions)
### Configuration Measurements
FLAME _endpoints_ (VMs created and managed by the SFEMC) and media service _media components_ (processes that realise the execution of the media service) both undergo changes in configuration state during the lifetime of a media service's deployment. Observations of these state changes are recorded in the CLMC under named measurement sets, for example 'endpoint_config' and '\<media component name\>_config' for endpoint and media component labels respectively. In each case, all recordable states of the endpoint/media component are enumerated as columns within the measurement set (see respective state models below for details). Example states include:
|Configuration Item|Configuration States|
|---|---|
|Network|e.g. available, unavailable|
|Physical Link|up, down, unknown|
|Server|e.g. available, unavailable|
|Port|up, down, unknown|
|Service function package|published, unpublished|
|Media service template|published, unpublished|
|Service function chain|submitted, scheduled, starting, running, stopping, stopped, error|
|Service function|starting, running, stopping, stopped, error|
|Endpoint|placed, unplaced, booted, connected, error|
>
> __Side note: a few definitions__
>
> 'EP' - Endpoint: a VM created and managed by the SFEMC
>
> 'MC' - Media component: a process that realizes a part or the whole of a media service
>
> 'Sampling period' - the time elapsed before Telegraf reports (plugin generated) metrics to the CLMC
>
> 'Completed state' - a state that has been entered into and then exited
>
> 'Current state' - a state that has been entered into but not yet exited
>
> 'MST' - Mean state time: the sum of each time taken by each completed state of type 'X' divided by the number of completed state 'X's; i.e:
>
>```math
> meanStateTime = \frac{\sum(endTimeOfState - startTimeOfState)}{numberOfTimesInState}
>```
>
Observation of EP or MC states will be performed by a Telegraf plugin. For example, a Telegraf plugin could periodically __report__ on the state of an NGINX process to the CLMC at a _fixed_ time interval (say 10 seconds). In between these times (the _sampling period_) the Telegraf plugin will sample (or 'poll') the state of the EP or MC several times (say 10 each second). Note that during any sampling period, the EP or MC _may_ transition from one state to another, as a simple example:
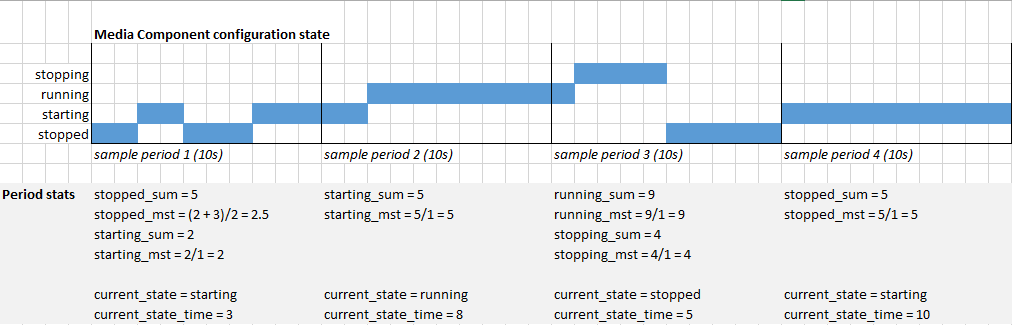
_Above: example observations within a four sampling periods for a MC configuration state_
In the example provided above a MC moves through several states. During each sampling period, the total time in the observed states is measured and for those that are _completed states_ a sum of all the time and the mean average time for that state is recorded. For any state that has not been observed during the sample period, the sum and average values will be recorded as zero. For a state that has not yet completed, this state will be considered as the 'current state' and the length of time in this state increases and does so continuously, over multiple sample periods if necessary, until it exits. Finally, if a state completes directly after sample period '1' ends and a new state begins before the start of the next sample period '2', then the previous current state (from period '1') should be recorded as _completed_ as part period '2's report.
In the following examples we illustrate how to calculate _mean time between failures_ (MTBF); _mean time to repair_ (MTTR) and _mean down time_ (MDT) for a media component (in our case, the _mpegdash_ MC) according to definitions found [here](https://en.wikipedia.org/wiki/Mean_time_between_failures).
_Q. What is the Mean Time Before Failure (MTBF) of media component 'mpegdash'?_
```
select mean(running_mst) as "mpegdash_MTBF(s)" from "mpegdash_mc_config" where running_mst <> 0
```
```
time mpegdash_MTBF(s)
---- ----------------
0 3602.1000000000004
```
_Q. What is the Mean Time to Repair (MTTR) of media component 'mpegdash'?_
```
select mean(starting_mst) as "mpegdash_MTTR(s)" from "mpegdash_mc_config" where starting_mst <> 0
```
```
name: mpegdash_mc_config
time mpegdash_MTTR(s)
---- ----------------
0 5.5
```
_Q. What is the Mean Down Time (MTD) of media component 'mpegdash'?_
```
select mean(starting_mst) as "starting_mdt" into "mpegdash_mc_config_mdt" from "mpegdash_mc_config" where starting_mst <> 0
select mean(stopping_mst) as "stopping_mdt" into "mpegdash_mc_config_mdt" from "mpegdash_mc_config" where stopping_mst <> 0
select mean(stopped_mst) as "stopped_mdt" into "mpegdash_mc_config_mdt" from "mpegdash_mc_config" where stopped_mst <> 0
select (starting_mdt + stopping_mdt + stopped_mdt) as "MDT(s)" from "mpegdash_mc_config_mdt"
```
```
name: mpegdash_mc_config_mdt
time MDT(s)
---- ------
0 6.8
```
## **Decision Context**
Monitoring data is collected to support service design, management and control decisions resulting in state changes in configuration items. The link between decisions and data is through queries and rules applied to contextual information stored with measurement values.

Every measurement has a measurement context. The context allows for time-based series to be created according to a set of query criteria which are then be processed to calculate statistical data over the desired time-period for the series. For example, in the following simple query the measurement is avg_response_time, the context is “service A” and the series are all of the data points from now minus 10 minutes.
`find avg response time for service A over the last 10 minutes`
To support this query the following measurement would be created:
`serviceA_monitoring,service_id=(string) response_time=(float) timestamp`
In the FLAME architeture we discuss at length the relationship between KPIs and dimensions, and implementations based on OLAP. In the current CLMC implementation, KPIs are calculated from measurement fields and dimensions are encoded within measurement tags. This is a lightweight implementation that will allow for a broad range of questions to be asked about the cross layer information acquired.
Designing the context for measurements is an important step in the schema design. This is especially important when measurements from multiple monitoring sources need to be integrated and processed to provided data for queries and decision. The key design principles adopted include:
* identify common context across different measurements
* where possible use the same identifiers and naming conventions for context across different measurements
* organise the context into hierarchies that are automatically added to measurements during the collection process

The following figure shows the general structure approach for two measurements A and B. Data points in each series have a set of tags that shares a common context and have a specific context related to the measurement values.

The measurement model considers three monitoring views on an endpoint with field values:
* service: specific metrics associated within the SF (either media component or platform component)
* network: data usage TX/RX, latency, jitter, etc.
* host: cpu, storage, memory, storage I/O, etc
All of the measurements on a endpoint share a common context that includes tag values:
* sfc – an orchestration template
* sfc_i – an instance of the orchestration template
* sf – a SF type
* sf_i – an instance of the SF type
* ipendpoint – an authoritive copy of the SF instance either VM or container
* server – a physical or virtual server for hosting VM or container instances
* location – the location of the server
By including this context with service, network and host measurements it is possible to support range of temporal queries associated with SFC’s. By adopting the same convention for identifiers it is possible to combine measurements across service, network and host to create new series that allows exploration of different aspects of the VM instance, including cross-layer queries.
* Decide on the service management decisions and time scales
* Decide on the measurements of interest that are needed to make the decisions
* Decide how measurements are calculated from a series of one or more other measurements
* Decide on time window for the series and sample rate
* Decide on interpolation approach for data points in the series
Each input measurement plugin can provide additional specific tags to filter measurement data.
## **Data Retention Policy**
*Discuss what data needs to be kept and for how long in relation to decision making*
## **Architecture**
### General
The monitoring model uses an agent based approach with hierarchical aggregation used as required for different time scales of decision making. The general architecture is shown in the diagram below.

To monitor a SF an agent is deployed on each of the endpoint implementing a SF. The agent is deployed by the orchestrator when the SF is provisioned. The agent is configured with
* a set of input plugins that collect measurements from the three viewpoints of network, host and service
* a set of global tags that are inserted for all measurements made by the agent on the host.
* 1 or more output plugs for publishing aggregated monitoring data.
Telegraf offers a wide range of integration with relevant monitoring processes.
Telegraf offers a wide range of integration for 3rd party monitoring processes:
* Telegraf AMQP: https://github.com/influxdata/telegraf/tree/release-1.5/plugins/inputs/amqp_consumer
* Telegrapf http json: https://github.com/influxdata/telegraf/tree/release-1.5/plugins/inputs/httpjson
* Telegraf http listener: https://github.com/influxdata/telegraf/tree/release-1.5/plugins/inputs/http_listener
* Telegraf Bespoke Plugin: https://www.influxdata.com/blog/how-to-write-telegraf-plugin-beginners/
The architecture considers hierarchical monitoring and scalability, for example, AMQP can be used to buffer monitoring information whilst InfluxDB can be used to provide intermediate aggregation points when used with Telegraf input and output plugin.
## **Measurements Summary**
## **Infrastructure Capacity Measurements**
Capacity measurements measure the size of the infrastructure slice available to the platform that can be allocated on demand to tenants.
*What is the format of the infrastructure slice and what data is available?*
Common tags
* slice_id – an idenfication id for the tenant infrastructure slice within openstack
**compute_node_config**
The *compute_node_config* measurement measures the wholesale host resources available to the platform that can be allocated to media services.
`compute_node_config,slice_id,server_id,location cpu,memory,storage timestamp`
**network_config**
network_config measures the overall capacity of the network available to the platform for allocation to tenants. There are currently no metrics defined for this in the FLIPS monitoring specification, although we can envisage usage metrics such as bandwidth being part of this measurement.
`network_config,slice_id,network_id, bandwidth,X,Y,Z timestamp`
**network_interface_config**
network_interface_config measures the connection bewteen a compute node and a network along with any constaints on that connection.
`network_interface_config,comp_node_id,port_id,network_id rx_constraint,tx_constraint timestamp`
## **Platform Measurements**
Platform measurements measure the configuration, usage and performance of platform components.
**topology_manager**
tbd
**nap**
nap measurements are the platforms view on IP endpoints such as user equipment and services. A NAP is therefore the boundary of the platform. NAP also measures aspects of multicast performance. NAP multicast metrics that require further understanding although NAPs contribution towards understanding the source of requests is important in decisions regarding the placement of endpoints. The following fields require some clarification:
* CHANNEL_AQUISITION_TIME_M
* CMC_GROUP_SIZE_M
* What is the group id for CHANNEL_AQUISITION_TIME_M and how can this be related to FQDN of the content?
* what is the predefined time interval for CMC_GROUP_SIZE_M?
* How are multicast groups identified? i.e. "a request for FQDN within a time period", what's the content granularity here?
NAP data usage measurement
`nap_data_io,node_id,ip_version RX_BYTES_HTTP_M,TX_BYTES_HTTP_M,RX_PACKETS_HTTP_M,TX_PACKETS_HTTP_M, RX_BYTES_IP_M, TX_BYTES_IP_M, RX_BYTES_IP_MULTICAST_M, TX_BYTES_IP_MULTICAST_M, RX_PACKETS_IP_MULTICAST_M, TX_PACKETS_IP_MULTICAST_M timestamp`
NAP service request and response metrics
`ipendpoint_route,ipendpoint_id,cont_nav=FQDN HTTP_REQUESTS_FQDN_M, NETWORK_FQDN_LATENCY timestamp`
**clmc**
tbd
### **IPEndpoint Measurements**
ipendpoint measurements measure the configuration, usage and performance of VM/Container instances deployed by the platform within the context of a media service.
Common tags
* location – a physical or virtual server for hosting nodes instances
* server – the location of the server
* sfc – an orchestration template
* sfc_i – an instance of the orchestration template
* sf – a SF package identifier indicating the type and version of SF
* sf_i – an instance of the SF type
* ipendpoint – an authoritive copy of the SF instance either a container or VM
**endpoint_config**
An endpoint configuration state model consists of the following states:
* unplaced
* placing [transitional]
* placed
* booting [transitional]
* booted
* connecting [transitional]
* connected
A simple example and some measurement rows for an endpoint configuration states is given in the table below. The scenario is the following:
Each sample period is 1 second.
First sample period reports the VM being in state __unplaced__ for 0.7s, then changing state to __placing__ for 0.3 seconds. __placing__ is not
reported since it is not a **completed state**. The mean state time value for __unplaced__ is the same as the sum value because the VM has only been once in this state.
Then the VM is reported to be in current state __placing__ for the whole sample period (1s) for 9 consecutive times. Only the 'current_state' tag value and the 'current_state_time'
field value are filled in the measurement rows, since the VM has not exited its state, yet.
The last sample period reports the VM exiting state __placing__, then changing state to __placed__. Hence, the __current_state__ tag is set to __placed__.
From the whole sample period (1s), the VM has been 0.9s in state 'placed'. Hence, the __current_state_time__ field is set to 0.9. For the other 0.1s of the sample period,
the VM has been reported to be in state __placing__. Since it has exited state __placing__, the total time spent in this state (9.3s + 0.1s = 9.4s) is reported.
This includes the state time from previous reports. The mean state time value for __placing__ is the same as the sum value because the VM has only been once in this state.
| global tags | current_state (tag) | current_state_time | unplaced_sum | unplaced_mst | placing_sum | placing_mst | placed_sum | placed_mst | booting_sum | booting_mst | booted_sum | booted_mst | connecting_sum | connecting_mst | connected_sum | connected_mst | time |
| --- | --- | --- | --- | --- | --- | --- | --- | --- | --- | --- | --- | --- | --- | --- | --- | --- | --- |
| ... | placing | 0.3 | 0.7 | 0.7 | 0 | 0 | 0 | 0 | 0 | 0 | 0 | 0 | 0 | 0 | 0 | 0 | ... |
| ... | placing | 1.3 | 0 | 0 | 0 | 0 | 0 | 0 | 0 | 0 | 0 | 0 | 0 | 0 | 0 | 0 | ... |
| ... | placing | 2.3 | 0 | 0 | 0 | 0 | 0 | 0 | 0 | 0 | 0 | 0 | 0 | 0 | 0 | 0 | ... |
| ... | placing | 3.3 | 0 | 0 | 0 | 0 | 0 | 0 | 0 | 0 | 0 | 0 | 0 | 0 | 0 | 0 | ... |
| ... | placing | 4.3 | 0 | 0 | 0 | 0 | 0 | 0 | 0 | 0 | 0 | 0 | 0 | 0 | 0 | 0 | ... |
| ... | placing | 5.3 | 0 | 0 | 0 | 0 | 0 | 0 | 0 | 0 | 0 | 0 | 0 | 0 | 0 | 0 | ... |
| ... | placing | 6.3 | 0 | 0 | 0 | 0 | 0 | 0 | 0 | 0 | 0 | 0 | 0 | 0 | 0 | 0 | ... |
| ... | placing | 7.3 | 0 | 0 | 0 | 0 | 0 | 0 | 0 | 0 | 0 | 0 | 0 | 0 | 0 | 0 | ... |
| ... | placing | 8.3 | 0 | 0 | 0 | 0 | 0 | 0 | 0 | 0 | 0 | 0 | 0 | 0 | 0 | 0 | ... |
| ... | placing | 9.3 | 0 | 0 | 0 | 0 | 0 | 0 | 0 | 0 | 0 | 0 | 0 | 0 | 0 | 0 | ... |
| ... | placed | 0.9 | 0 | 0 | 9.4 | 9.4 | 0 | 0 | 0 | 0 | 0 | 0 | 0 | 0 | 0 | 0 | ... |
**net**
https://github.com/influxdata/telegraf/blob/master/plugins/inputs/system/NET_README.md
[[inputs.net}}
`net,interface=eth0,host=HOST bytes_sent=451838509i,bytes_recv=3284081640i,packets_sent=2663590i,packets_recv=3585442i,err_in=0i,err_out=0i,drop_in=4i,drop_out=0i 1492834180000000000`
**cpu_usage**
https://github.com/influxdata/telegraf/blob/master/plugins/inputs/system/CPU_README.md
[[inputs.cpu]]
`cpu_usage,<common_tags>,cpu cpu_usage_user,cpu_usage_system,cpu_usage_idle,cpu_usage_active,cpu_usage_nice,cpu_usage_iowait,cpu_usage_irq,cpu_usage_softirq,cpu_usage_steal,cpu_usage_guest,cpu_usage_guest_nice timestamp`
**disk_usage**
https://github.com/influxdata/telegraf/blob/master/plugins/inputs/system/DISK_README.md
[[inputs.disk]]
`disk,<common_tags>,fstype,mode,path free,inodes_free,inodes_total,inodes_used,total,used,used_percent timestamp`
**disk_IO**
https://github.com/influxdata/telegraf/blob/master/plugins/inputs/system/DISK_README.md
[[inputs.diskio]]
`diskio,<common_tags>,name weighted_io_time,read_time,write_time,io_time,write_bytes,iops_in_progress,reads,writes,read_bytes timestamp`
**kernel_stats**
https://github.com/influxdata/telegraf/blob/master/plugins/inputs/system/KERNEL_README.md
[[inputs.kernel]]
`kernel,<common_tags> boot_time,context_switches,disk_pages_in,disk_pages_out,interrupts,processes_forked timestamp`
**memory_usage**
[[inputs.mem]]
`mem,<common_tags> cached,inactive,total,available,buffered,active,slab,used_percent,available_percent,used,free timestamp`
**process_status**
https://github.com/influxdata/telegraf/blob/master/plugins/inputs/system/PROCESSES_README.md
[[inputs.processes]]
`processes,<common_tags> blocked,running,sleeping,stopped,total,zombie,dead,paging,total_threads timestamp`
**system_load_uptime**
https://github.com/influxdata/telegraf/blob/master/plugins/inputs/system/SYSTEM_README.md
[[inputs.system]]
`system,<common_tags>,host load1,load5,load15,n_users,n_cpus timestamp`
## **Media Service Measurements**
Media service measurements measure the configuration, usage and performance of media service instances deployed by the platform.
**media_service_config**
A media component configuration state model consists of the following states:
* stopped
* starting [transitional]
* running
* stopping [transitional]
An example (based on the figure above) of some measurement rows for a media component configuration states is below:
| global tags | current_state (tag) | current_state_time | stopped_sum | stopped_mst | starting_sum | starting_mst | running_sum | running_mst | stopping_sum | stopping_mst | time |
| --- | --- | --- | --- | --- | --- | --- | --- | --- | --- | --- | --- |
| ... | starting | 3 | 5 | 2.5 | 2 | 2 | 0 | 0 | 0 | 0 | ... |
| ... | running | 8 | 0 | 0 | 5 | 5 | 0 | 0 | 0 | 0 | ... |
| ... | stopped | 5 | 0 | 0 | 0 | 0 | 9 | 9 | 4 | 4 | ... |
| ... | starting | 10 | 5 | 5 | 0 | 0 | 0 | 0 | 0 | 0 | ... |
**<prefix>_service**
Each SF developed will measure service specific usage and performance measurements. Telegraf offers plugins for many middleware services, however, it is likely that specific monitoring plugins will need to be developed where existing plugins are not available or the data is not sampled as required. The following is a theoretical example for media service monitoring.
`<prefix>_service,<common_tags>,cont_nav,cont_rep,user <fields> timestamp`
Fields (only examples as these are specific to each service)
* request_rate
* response_time
* peak_response_time
* error_rate
* throughput
Specific Tags
* cont_nav: the content requested
* cont_rep: the content representation requested
* user: a user profile classification
### Service Function Chain Measurements
**sfc_i_config**
SFC configuration state monitoring implemented in accordance with the CLMC state model
`sfc_i_config,<common_tags>,current_state <fields> timestamp`
**sfc_i_monitoring**
Aggregate measurement derived from VM/container measurements, most likely calculated using a continuous query over a specific time interval
**sf_i_config**
SFC instance configuration state monitoring implemented in accordance with the CLMC state model
`sf_i_config,<common_tags>,current_state <fields> timestamp`
**sf_i_monitoring**
Aggregate measurement derived from ipendpoint measurements, most likely calculated using a continuous query over a specific time interval
**ipendpoints**
Aggregate measurement derived from ipendpoint measurements, most likely calculated using a continuous query over a specific time interval
`ipendpoints,<common_tags>, placed, unplaced, booted, connected`